

Published on Medium, 15 September 2021.
I will explain why lab-grown meat is going to be a thing, I promise. But it may be a bit of a wander. Ready? Let’s go.
Part I: The Underlying Phenomenon
The first name that typically comes up when someone hears about exponential technologies is Gordon Moore.
In 1965, Moore, one of the co-founders of Intel, made the observation that the number of transistors we could fit on an integrated circuit had been doubling every 18 months or so¹. He also made a prediction: that the number would continue to double, as far forward as we could see.
That prediction — you may have heard of it — is now famously known as “Moore’s Law,” and it’s still going strong:

But there’s a a fun fact you may not know about Moore’s Law.
Gordon Moore based his prediction on a dataset of…
…wait for it…
Four.
He had just four data points, and from them generated his entire hypothesis.
This “law,” this self-fulfilling prophecy that has guided the entire computer industry for more than 50 years, was, as Moore called it, a “wild extrapolation.”
But then Ray Kurzweil came along. An inventor and futurist, Kurzweil asked an important question: What if, instead of looking at the number of transistors we can fit on an integrated circuit, we look instead at what we might call the price-performance of computing?
The specific question Kurzweil asked was this: How many instructions per second can you buy for $1,000?
It may seem like an arbitrary distinction, but it’s an important one. Where Moore was asking an engineering question, Kurzweil had gone up a level of abstraction — and, in doing so, allowed us to see the underlying phenomenon.
As it turns out, the answer to Kurzweil’s question is a number has been doubling for over 120 years.

Most exponential curves are charted on a log scale, meaning the y-axis goes 1, 10, 100, 1000 instead of 1, 2, 3, 4. A straight line on a log scale is an exponential curve.
Kurzweil’s “Law of Accelerating Returns” started with electromechanical punch cards before moving on to relays, vacuum tubes, transistors, and only then integrated circuits.
Seen through this lens, Moore’s Law is actually the fifth iteration of the underlying doubling phenomenon, not the first. Every time we’ve maxed out on a given technology, a new one has come along to continue the trend.
Part II: Not Just Computing
Kurzweil’s insight allowed us to understand that this trend is not about transistors, it’s about digitisation. It’s about the shift from the physical world to the world of information.
And it doesn’t just apply to computing. Once any technology becomes information-enabled — powered by ones and zeroes — it too will start to follow a similar doubling trend².
Think about photography. Photography used to be substrate-enabled: you were dependent on physical film to do the thing.
But then we created the digital camera.
The first digital camera, in 1975, had a resolution of 0.01 megapixels. Today, the camera on my phone has a resolution of 40 megapixels.
There are lots of examples where we can see the trend. Let’s take a look at a few, starting with the cost to sequence a human genome.

It cost $2.7 billion to sequence the first genome, including the need to sequence a bunch of different organisms and do a whole heap of ancillary research. And then for a few years the price came down at a pace almost entirely consistent with Moore’s Law.
And then, in 2007, Next-Generation Gene Sequencing came on the scene, and the price plummeted from $10 million to $1 million in less than a year. As of last August, it cost less than $700 to sequence a genome. Expert biotechnologist Raymond McCauley anticipates a near future in which it will be cheaper to sequence your genome than it is to flush your toilet.
Let’s try one of my favourite charts of all time, from the CIA, the World Bank, Bernstein and the Energy Information Administration. It’s called Welcome to the Terrordome, and it measures the price-performance of energy by different fuel types:

He didn’t create this chart but the best place to find it is on my friend Ramez Naam’s website
So on the y-axis we’ve got price per million BTUs (British Thermal Units, a measure of heat), and on the x-axis we’ve got the year, and we’re charting 5 different fuel types. And four of them start in 1949 and kind of bump along the bottom. They go up and down and up and down and gradually trend upwards.
Those are our linear technologies — coal, gas, oil — and that is what linear technologies do in terms of price-performance: they bump along and gradually trend upwards. Linear technologies are inflationary in nature.
And then… What’s this? Doesn’t even come onto the chart until around 2007… And when it comes onto the chart it’s so expensive that all of the incumbents are like, “It’s never going to be a thing…” And then the price plummets…
That’s solar. Solar is information-enabled energy, coming down in price faster than Moore’s Law. That chart was created in 2012. Here’s what’s happened since:

This one is fully from Ramez; check it out here
Okay, one more: LED lighting. Five years ago, Michael J Coren published this chart, showing the price of LED lighting plummeting while the lifetime of a bulb skyrocketed:

Statista projects that price decline to continue at pace, projecting the price to drop by more than 40% between 2017 and 2020:

Note that, while these charts may all look slightly different to each other, they’re all measuring the same thing: how much performance you can buy for a given amount of money, or how much it costs to achieve a fixed level of performance. In other words, the relationship between price and performance.
Part III: Finally, The Bit About Food
One of the things that happens when costs come down by that much is that entire use cases open up that had previously been impossible.
For example, when I first saw the chart about LED lighting, I was pretty unimpressed. I mean, I don’t know about you, but light-bulb expenditure isn’t high on the list of things that keep me up at night.
But I was completely missing the big picture. An exponential advance in LED lighting doesn’t just mean household lighting is a bit cheaper. It means indoor farming is suddenly viable.
Until recently, because it was so expensive, indoor farming was limited to certain… let’s call them ‘high-value crops.’

Yes, obviously I was talking about weed. Image by noexcusesradio from Pixabay
But because LEDs have come down by so much, indoor farming is now starting to become competitive with traditional farms.
In 2016, Jason Green, CEO and co-founder of Edenworks, an indoor aquaponic farm in Brooklyn, said, “Our overall facility would have cost four times [the price] if we built it with LEDs in 2010.” In 2018, when 80 Acres Farms broke ground on a major expansion to arrive at three fully automated indoor farms totaling 150,000 square feet and a fourth for 30,000 square feet of vine crops, 80 Acres President Tisha Livingston said, “We feel the time is right for us to make the leap because the lighting efficiency is there.”
This sudden viability has resulted in a flood of funding. Investors have pumped $1.8 billion into vertical farming since 2014, with more than $500 million of that in 2020 alone.
But indoor farming isn’t the only food sector being disrupted by exponential tech. Remember this Terrordome chart?

Same chart from up above, just reminding you what it looks like
Well, one day my friend Grant Ryan, a brilliant inventor, asked me what it might look like if we ran that same analysis for lab-grown meat.
So we did.
Here’s the starting point: the price-performance of beef and chicken.

As you can see, this chart is exactly the same as the Terrordome one: price per kilogram on the y-axis, year on the x-axis. Our data only goes back to 1980, but that’s still good enough for statistical purposes. And what we see is exactly the same as what we saw with coal, gas and oil: the prices bump along, going up and down, and gradually trending upwards.
Now let’s take a look at it when we add in lab-grown meat:

First thing to notice is that we had to change the y-axis to a log scale because otherwise our data³ wouldn’t fit on the chart.
The first data point we had for a kilogram of lab-grown meat was just under $2.3 million. The second data point, just three years later, was just under $40,000. The third, a year after that, was $80. Last year we got down to $22.43.
Cultured meat has gone from $2.3 million dollars per kilogram to just over twenty dollars per kilogram — a 99.999% drop in price — in just seven years.
Last year, cellular agriculture company Mosa Meat announced they had reduced the cost of their cell culture media (the nutrient broths that feed the cells so they can proliferate) by 88% in 10 months:

Somebody at Mosa Meat definitely got a promotion for this
This year, the same company revealed they’ve been able to reduce the cost of their fat differentiation media by 98.48% in 18 months.
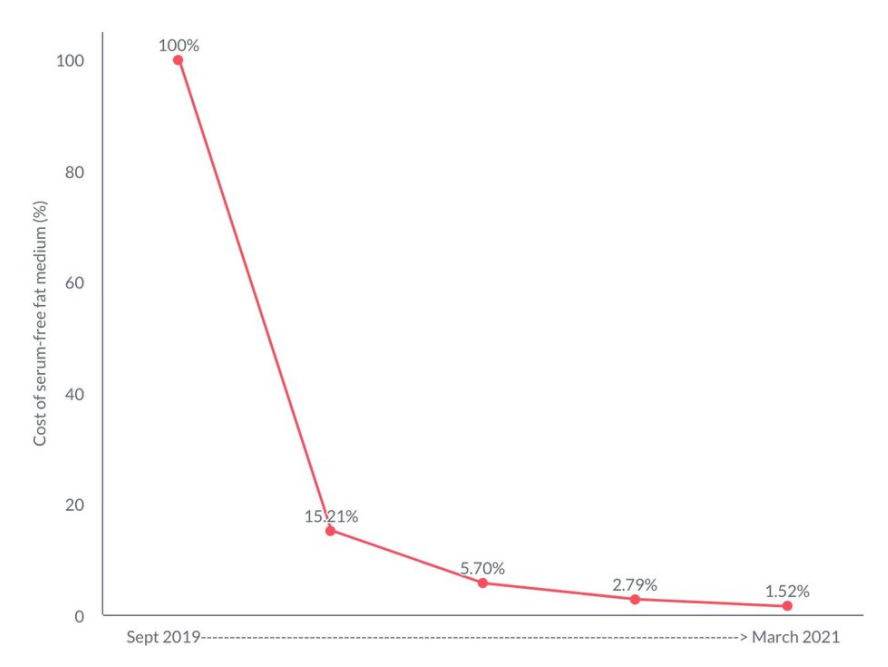
No, you can’t buy shares in them yet
We’ve got a long way to go before lab-grown meat and even vertically-farmed produce make a significant dent in the traditional food market.
But—based on the exponential trends—does anyone really doubt we’ll get there?
Kaila Colbin, Certified Dare to Lead™ Facilitator
Co-founder, Boma Global // CEO, Boma NZ
Footnotes
Moore’s original article suggested the number of transistors would double every year. In 1975 he revised his prediction to a doubling every two years.
You could argue that it’s all variations on the same trend; that is, once a technology becomes information-enabled it’s powered by computers that are following the Law of Accelerating Returns.
